

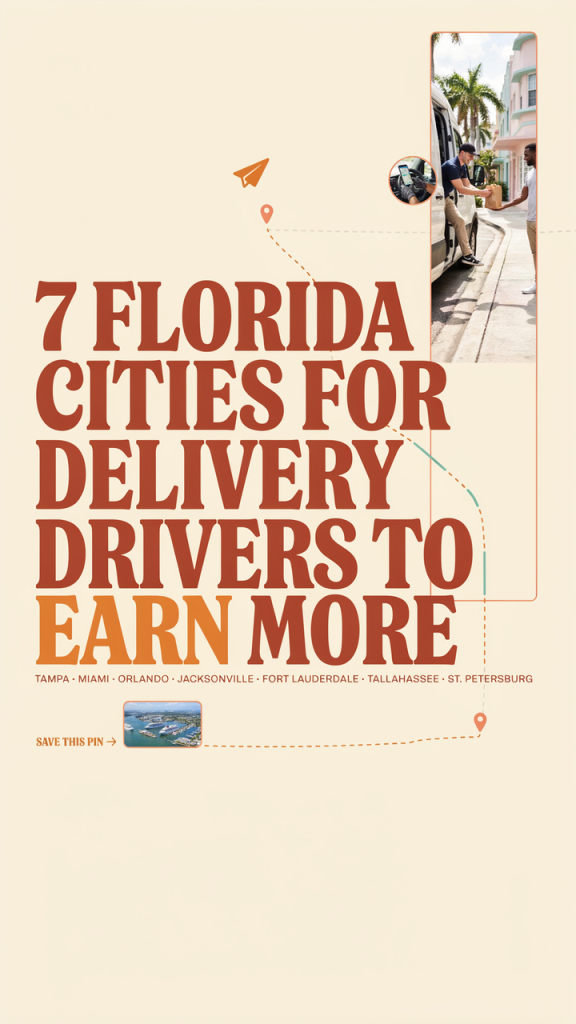
If you already drive for DoorDash, Uber Eats, Grubhub, Instacart, or you’re thinking of moving to Florida to drive, this guide gives a practical, testable method for picking the best city and neighborhoods for your goals. TL;DR: target Miami for dense downtown and late-night volume, Orlando for event-and-tourist boosts, Tampa suburbs for steady apartment-cluster shifts, Gainesville for predictable college spikes, and Fort Lauderdale for high-average-order weekend surges — and use a simple 3-shift experiment plus cost-of-living adjustment to confirm which market fits you.
Key Takeaways
How we pick “high-earning” markets
Drivers should evaluate markets with repeatable, observable signals. Use these metrics and simple checks — you can collect them in a notebook or a spreadsheet during a short market test.
- Order density proxy: count restaurants clustered within a 1-mile radius of a potential hotspot (downtown, mall, university). More restaurants per square mile = less dead driving between pickups.
- Average ticket size proxy: look for areas with higher-end restaurants, hotel room service, and grocery/market stores—these tend to generate bigger orders and stacking opportunities.
- Surge/peak frequency proxy: track how often you see long wait times or “busy” status in the app (note times/days); also check event calendars (concerts, sports, conferences).
- Restaurant diversity: a mix of fast-casual, full-service, and grocers keeps orders flowing across lunch, dinner, and late-night.
- Parking and traffic friction: observe how long it takes to park and reach doors during peak times; heavy meter/garage dependence reduces effective hourly.
- Cost-of-living adjustment: compare rent and commute costs to potential gross to estimate net earnings target. Use local rental listings, average commute distance, and typical gas prices to adjust expectations.
- Seasonality and events: the presence of tourism, college calendars, and major conventions changes weekly and yearly demand.
How to collect these on a quick trip
– Walk a 15-minute radius in the area with your phone and count restaurants and visible foot traffic; note hotel density and nearby stadiums/conference centers.
– Open all delivery apps and watch how often jobs appear in a 30–60 minute window at lunch and dinner.
– Check local event calendars for big upcoming weekends (sports, festivals, holiday parades).
– Drive the route between common restaurant clusters and multi-unit housing; note whether traffic looks like a slow crawl or steady.
Ready to turn an idea into practical income?
Florida market snapshot: statewide patterns drivers must know
– Tourism seasonality: Florida has heavy tourist swings. Winter (thanksgiving–spring break for many areas) and holiday weekends bring hotel-to-table and high-volume crowds. Summer has local beach traffic and festival pockets; hurricane season (June–November) can suppress demand on bad-weather days and spike it before storms.
– College towns vs. metro cores: college towns (Gainesville, Tallahassee) show steep spikes around classes, game days, and student nights, making short, intense shifts profitable. Metro cores (Miami, Tampa) offer steadier volume across all-day windows and more late-night options.
– Suburb clusters: suburban apartment complexes, mixed-use developments, and office parks create long steady shifts where multiple orders can be stacked and delivered in the same zone.
– Weather impacts: rain can double or triple short-term demand in dense downtown areas but will also slow traffic and increase parking difficulty.
– Parking and enforcement: municipal parking rules vary widely—metered streets, red-zone enforcement, and private garages overhead can quickly erode trip profitability.
Top Florida markets to prioritize
Each market profile below follows the same structure so you can compare quickly.
Market A — Miami (Downtown, Brickell, Wynwood)
Why it ranks (data-driven reasons)
– High restaurant density in downtown/Brickell plus a large late-night population in Wynwood and South Beach adjacent neighborhoods.
– Strong hotel and nightlife presence creates long evening windows and high order frequency per square mile.
Best neighborhoods to work
– Brickell (dense apartment towers and offices)
– Wynwood (nightlife/late-night food)
– Downtown Miami (courthouse, office workers, tourists)
– Edgewater (residential towers near restaurants)
Peak days & hours
– Weekdays: lunch 11:30–1:30 pm, dinner 6–9 pm
– Weekends: late night 10 pm–2 am for bars and clubs; Saturday midday is also strong
Common high-value restaurant types
– High-end restaurants and seafood markets (bigger tickets), hotel room service, Latin comfort food for group orders
Parking/traffic and safety notes
– Meters and garages are common; avoid tight one-way streets downtown during rush hour. Stay aware of car break-in risks; keep belongings out of sight.
Downsides to watch for
– Traffic congestion, parking fees, and frequent restaurant and hotel stairs/jobs where you may walk multiple flights.
Quick tips for immediate earnings gains
– Position near Brickell Circle or downtown courts for lunch and switch to Wynwood or South Beach for evening runs. Use apps concurrently during late-night windows where demand spikes.
Market B — Orlando (Lake Eola, Restaurant Row, International Drive)
Why it ranks
– Large tourism engine (theme parks, conventions, hotels) creates event-driven and sustained customer demand, especially for dinner and group orders.
– Convention calendar and hotel clusters increase peak frequency and average ticket size when events are running.
Best neighborhoods to work
– International Drive/Convention Center area (high hotel density)
– Restaurant Row/Mills 50 (local restaurants and offices)
– Lake Eola (downtown residents and office lunch rush)
Peak days & hours
– Peak dinners 5–9 pm and Saturday daytime (park closing times and convention breaks)
– High surge activity during conventions and major attractions’ slow evenings
Common high-value restaurant types
– Chains with delivery-ready packaging, family style restaurants (bigger orders), and tourist-oriented cafés
Parking/traffic and safety notes
– International Drive has frequent traffic and limited free parking; working hotel service can be profitable but often requires valet or garage navigation.
Downsides to watch for
– Heavy congestion around park exit times, unpredictable event schedules, and long drop-offs for hotel areas with strict gate/valet rules.
Quick tips for immediate earnings gains
– Watch convention center calendars; stack meals from Restaurant Row during lunch and move to International Drive for dinner when convention centers let out.
Market C — Tampa (Westshore, Channelside, University area)
Why it ranks
– Suburban clusters near office parks and high-rise apartments create long stretches of steady orders; Channelside and Westshore are delivery hotspots with many restaurants per square mile.
– Mix of office lunch demand and evening residential deliveries yields flexible shift opportunities.
Best neighborhoods to work
– Westshore (airport-adjacent hotels and offices)
– Channelside/Ybor City (dining and event venues)
– University area (steady student and staff orders)
Peak days & hours
– Lunch 11:30–1:30 pm for office clusters, dinner 6–9 pm, and Saturday event afternoons
Common high-value restaurant types
– Pizza shops (multi-order stacks), family restaurants, and bar food near event venues
Parking/traffic and safety notes
– Suburban roads often have free parking near delivery pickup points, but Ybor and Channelside can be constrained on event nights.
Downsides to watch for
– Suburban spread increases dead time if you don’t position near clusters; occasional long interstate traffic affects trip times.
Quick tips for immediate earnings gains
– Focus on apartment complexes in Westshore for multiple short hops; use stacking during lunch with chains and pizza shops to reduce travel per order.
Market D — Gainesville (Downtown, UF Campus, Stadium corridor)
Why it ranks
– College town with concentrated demand tied to class schedules, game days, and student nightlife; predictable spikes make short, targeted shifts lucrative.
Best neighborhoods to work
– Downtown Gainesville (student housing and bars)
– University Avenue corridor (restaurants and campus access)
– Stadium corridor during home games
Peak days & hours
– Weekdays: evenings 5–10 pm; weekends: Friday–Saturday late night 10 pm–2 am
– Game days: 3 hours before kickoff through halftime and just after the game
Common high-value restaurant types
– Fast-casual chain clusters, late-night pizza/delivery joints, and food trucks near campus
Parking/traffic and safety notes
– Ample curb parking in many spots; during games, lots fill quickly—plan to position near accessible parking.
Downsides to watch for
– Highly volatile: long slow stretches during academic breaks and exam weeks.
Quick tips for immediate earnings gains
– Work 90–120 minute micro-shifts that coincide with class change times and game celebrations; late-night shifts on Fridays and Saturdays typically beat daytime hours.
Market E — Fort Lauderdale (Las Olas, Beach corridor, Downtown)
Why it ranks
– Mixed resort and urban zones produce high average order sizes from tourists and event-goers, plus weekend surges for beach and nightlife.
Best neighborhoods to work
– Las Olas (restaurants and bars)
– Fort Lauderdale Beach (resorts and vacation rentals)
– Downtown/Sistrunk (residential and event venues)
Peak days & hours
– Weekend peaks: Friday–Sunday evenings and late nights
– Midweek tourist check-in days can spike afternoon orders
Common high-value restaurant types
– Seafood and upscale dining, group orders from vacation rentals, and full-service restaurants
Parking/traffic and safety notes
– Beach areas have heavy enforcement and metered parking; short-term parking lots cost money but shorten walk times.
Downsides to watch for
– Parking fees and tourist crowds can increase wait and walk time; some narrow beach streets complicate drop-off.
Quick tips for immediate earnings gains
– Position near resorts during check-in hours (3–6 pm) and Las Olas for dinner runs; pick neighborhoods with free short-term lots for quick turnarounds.
How seasonal factors change rankings and when to pivot
– Winter months (Dec–Apr): Miami and Fort Lauderdale see strong tourist inflow; pivot there if you chase high variance weekends.
– Spring Break and college vacation weeks: Gainesville and other college towns slow dramatically—switch to metro areas or tourist hubs.
– Summer and hurricane season: watch weather forecasts. Drive the day before expected severe weather to capture last-minute orders, but avoid unsafe driving conditions.
– Event-driven pivots: plan to temporarily target convention centers, stadiums, and festival venues when large events are scheduled — these can temporarily outrank your usual market.
How to choose the right market for you
Decision checklist
– Commute cost vs. expected gross: calculate driving time to hot zones and sample expected gross per hour there versus local costs (rent, insurance).
– Vehicle wear: city driving increases stop-and-go wear; if you value low maintenance, select suburbs with longer, steady trips.
– Shift length preferences: short, high-frequency shifts favor downtowns and college areas; long steady shifts suit suburbs and apartment clusters.
– Safety and comfort: trust your local knowledge; avoid neighborhoods where you don’t feel safe making evening deliveries.
– Income stability vs. variance appetite: do you need steady daily pay or can you accept big spikes and slow days? Choose suburban steady markets for stability; tourist downtowns for spikes.
Multi-app and stacking strategies
When to run single app vs. stacked
– Single-app focus: when you’re learning a market, stick to one app for a few shifts to learn hot spots and accepted patterns.
– Multi-app stacking: during peak windows with high order density, stack apps so you can accept the best orders while keeping acceptance rate heuristics in mind.
Acceptance rate and simple heuristics
– Prioritize orders that fit a radius-based mental model: pickups under 4 minutes and drops under 10 minutes in dense clusters.
– Favor higher average ticket areas during dinner and events, and accept larger orders during low trip density times.
Switching apps during slow periods
– If orders dry up on one app for 15–30 minutes during a shift, go quiet and open a second app to test volume for 10–20 minutes. If both are slow, reposition to a new hotspot rather than waiting in place.
Stacking safety and customer service
– Communicate clearly to customers when there are delays caused by multiple drops; prioritize door-to-door accuracy and safeguard perishables.
Peak-week playbook: sample 7-day schedule to maximize weekly pay
Goal: maximize gross in your chosen market, balancing rest and high-value windows.
Day 1 (Monday)
– Work a 4-hour lunch shift 11:30–3 pm in downtown, then a 3-hour dinner shift 5–8 pm.
– Stack apps at lunch; prioritize downtown office buildings.
Day 2 (Tuesday)
– 4-hour evening shift 5–9 pm targeting high-end restaurants and hotel zones.
– Avoid late nights unless the market shows a late surge.
Day 3 (Wednesday)
– Short 3-hour lunch pivot to suburban apartment clusters; try grocery or market orders if available.
Day 4 (Thursday)
– 6-hour split shift: midday 11:30–1:30, then evening 6–10 pm. Weeknight event testing (concerts, theater).
Day 5 (Friday)
– Full evening: 4–11 pm with late-night coverage. Stack apps for late-night bar food and hotel orders.
Day 6 (Saturday)
– Focus on 10 am–3 pm and 6–11 pm; target tourist areas and beach resorts for larger orders.
Day 7 (Sunday)
– Short morning/lunch 11–3 pm and a 2-hour early evening push. Use the rest of the day for vehicle upkeep and planning.
Shift tactics
– Start 15–30 minutes before the target window in a known hotspot to catch early orders.
– Carry insulated bag(s), phone battery, and a basic first-aid/umbrella kit for weather.
– Avoid high-fee parking lots unless the time saved justifies the expense for multiple short hops.
Sample earnings scenarios (use these as conservative vs. optimistic illustrations)
Assumptions to keep in mind: gross pay depends on order frequency, tips, driving time, and the apps used. The ranges below are examples based on typical rural-to-urban differences and shift lengths; adjust for your local cost and speed.
Profile 1 — Part-timer (evenings and weekends)
– Schedule: 12–16 hours weekly (6–8 short shifts)
– Conservative gross estimate: $120–$240/week
– Optimistic gross estimate (good app stacking and busy market): $240–$400/week
– Typical weekly expenses: gas (~$30–$60), maintenance reserve (~$15–$30), insurance prorated (~$15)
– Net take-home conservative: $60–$140/week; optimistic net: $150–$280/week
Profile 2 — Full-time curb-hopper (40 hours, high density market)
– Schedule: 40 hours weekly, peak windows and weekends
– Conservative gross estimate: $1,000–$1,400/week
– Optimistic gross estimate: $1,400–$1,900/week
– Typical weekly expenses: gas (~$80–$160), maintenance reserve (~$40–$80), insurance proration and taxes (~$150)
– Net take-home conservative: $730–$1,110/week; optimistic net: $1,020–$1,510/week
Profile 3 — Student-runner (part-time day and late-night micro-shifts)
– Schedule: ~20 hours weekly (micro-shifts between classes and evenings)
– Conservative gross estimate: $200–$360/week
– Optimistic gross estimate: $360–$600/week
– Typical weekly expenses: gas (~$25–$50), maintenance reserve (~$20–$40), insurance proration (~$10)
– Net take-home conservative: $145–$290/week; optimistic net: $270–$520/week
Notes on these scenarios
– These ranges are illustrative. Your mileage, packing efficiency, and local tipping culture change outcomes dramatically.
– Always set aside 20–30% of gross for quarterly tax estimates and an additional maintenance fund to avoid surprises.
Safety, legal, and practical considerations
Safe parking and delivery practices
– Park legally and close to the entrance; use hazard lights only when appropriate and be mindful of local parking enforcement.
– Avoid walking into poorly lit or isolated locations; if you don’t feel safe, cancel and explain politely via the app.
– Keep vehicle valuables hidden; secure insulated bags and receipts in the trunk.
Dealing with bad weather
– Reduce speed, allow extra time for navigation, and make sure your phone mount and lights are functional.
– If conditions are unsafe (flooding, hurricane advisories), prioritize personal safety over orders.
Local regulations and ordinances to check
– Some municipalities limit delivery parking zones, curbside pickups, or impose special permits for commercial activity. Check city or county business regulations if you’re planning to work heavily near tourist zones or stadiums.
Tax reminders
– Track all income and expenses. Keep receipts for fuel, maintenance, and gear. Consider using a simple spreadsheet or an app to separate business miles and personal miles. Set money aside for estimated taxes quarterly to avoid year-end surprises.
Tools and resources for ongoing market research
– Public data: city calendars, tourism board event listings, and university schedules.
– Driver groups: local Facebook/Discord groups and messaging channels often post real-time hotspots and surge updates.
– Heatmap tools: open the order heat features in your delivery apps and compare them across different times and days.
– Quick market test: the 3-shift experiment (below) gives concrete KPIs to decide whether to continue or move markets.
How to test a market quickly: the 3-shift experiment
– Shift 1 (lunch): 90–120 minutes during 11:30–1:30 pm. Record orders accepted, average miles per trip, gross earnings, and downtime.
– Shift 2 (dinner): 120–180 minutes during 6–9 pm. Record same KPIs and note restaurant types and parking situations.
– Shift 3 (weekend peak): 120–240 minutes during Saturday or Sunday peak windows. Compare order frequency and average ticket size to previous shifts.
KPIs to track
– Orders per hour, average miles per order, average gross per hour, average tip per order, and time waiting between orders.
Decision rule after 3 shifts
– If average gross per hour covers your target net hourly after expenses and you have at least 1.5 orders/hr in dense markets (or a reliable 0.8–1.2 orders/hr in suburbs with larger tickets), keep testing that market. Otherwise, reposition to a different neighborhood or market.
Step-by-step action plan: 1-week checklist to pick and test a market
Pre-shift prep
– Inspect vehicle, charge phone, load insulated bag, and pack water.
– Choose three neighborhoods per target market (downtown, residential cluster, tourist/hotel cluster).
Where to log on
– Arrive 10–15 minutes early at your target hotspot; be near pickup points with visible restaurant clusters.
What to track during shifts
– Time logged on, time between orders, miles driven, gross per hour, tips, and parking fees.
When to pivot during a shift
– After 30 minutes with no orders or after two long-distance low-pay trips, pause and reposition to the next hotspot.
How to decide if you should change markets
– After three shifts in a market, compare your gross/hour and net after expenses to your minimum required income. If you fall short repeatedly or feel unsafe/uncomfortable, reopen the list of markets and run another 3-shift experiment.
Final thoughts and next steps
Picking the best Florida market for delivery driving is a mix of data-minded observation and real-world testing. Use the simple metrics here — restaurant density, ticket-size proxies, parking friction, and seasonality — then confirm with a targeted 3-shift experiment. Start in one of the recommended markets based on your tolerance for traffic, weather, and income variance, and refine your routine with stacking tactics, consistent KPIs, and local driver networks. Try the 3-shift experiment this week, join a local group to get real-time tips, and keep a small notebook of what works — your best market is rarely the one that sounds best on paper, but the one that fits your vehicle, schedule, and financial goals in practice.